Kojable research · Finance GEO measurement · 496 target-oriented AI responses
Branded AI Visibility Is Not Market Visibility: What the 90.7% Finance GEO Result Actually Measures
A companion analysis of 496 finance AI responses showing why strong first-party source presence after a company is named should not be interpreted as general market visibility, share of voice or recommendation probability.
Key finding
Target-owned sources appeared in 450 of 496 target-oriented finance prompt runs—90.7%—but the company was already part of the research frame. The metric measures first-party evidence participation once a target is in scope, not whether AI independently selects that company from the market.
Qualification: The experiment did not use a representative unbranded finance query universe. The 90.7% result is not market share, AI share of voice, recommendation probability or unaided company discovery.
- Branded discoverability
- Market visibility
- AI measurement
- 17 min read
Study overview
Executive summary
A finance company appears through its own sources in nine out of ten AI answers where that company is already part of the question. Is that evidence of market leadership? No. It is evidence of something narrower and still commercially important: branded discoverability.
Across 496 target-oriented finance prompt runs covering 49 company domains, a target-owned source appeared in 450 responses. The observed prompt-weighted rate was 90.7%, with a descriptive 95% Wilson interval of 87.9% to 93.0%.
The result says that first-party information was usually present when the company was already in scope. It does not say that a company would be discovered, mentioned, shortlisted or recommended in 90.7% of neutral finance-category questions.
Branded discoverability, consideration-set visibility, representation quality, evidence visibility and recommendation outcomes are different measurement layers. A single “AI visibility” score can collapse them and hide the actual problem a company needs to solve. This companion paper focuses on that measurement boundary.
Answer first
Direct answer
The 90.7% result is best interpreted as a target-oriented owned-source presence rate: when a finance company was already part of a branded, comparison or otherwise target-oriented question, how often did a named source attributable to that company appear in the response?
It does not answer how often an AI system will independently choose the company for a neutral category question. The first measures whether a company’s information can participate once the company is already relevant. The second measures whether the company enters the AI-generated consideration set before the user names it.
Companion analysis
Research lineage
This companion analysis uses the same 496-response finance dataset as What 496 Grounded AI Responses Reveal About Finance GEO Visibility. The earlier paper reports the full empirical source landscape, including external publisher incidence, source identity and response-level co-citation.
This research asks a narrower measurement question: what can the owned-source rate tell us about branded discoverability, and what additional experiment would be required to claim general market visibility? It is not a new or independent 496-response experiment.
Operational definition
What the 90.7% result actually measures
The underlying collection included 496 target-oriented prompt runs across 49 finance domains, 495 successful responses, one model—gemini-2.5-flash-lite—US English and a 14–15 January 2026 collection window.
The observed outcome was straightforward:
Did the response contain at least one named source classified as belonging to the target domain?
That happened in 450 of 496 prompt runs.
- Numerator
450 responses containing at least one target-owned named source.
- Denominator
496 target-oriented prompts in which a finance company was already part of the research frame.
The result is about evidence participation after the target entered the question. It is not a market-share denominator, brand-mention rate, recommendation rate, rank, endorsement or win rate.
Interpretation
The denominator determines the meaning
Visibility percentages are easy to overinterpret because the numerator attracts attention while the denominator quietly defines the claim. The 496-prompt denominator was not:
- All finance demand
The prompts were not a representative sample of every finance question users might ask.
- A neutral category query set
Targets were already named or otherwise placed inside the research frame.
- Every candidate or recommendation opportunity
The study did not define an eligible market candidate universe or observe all possible shortlists.
- All models, markets, languages or time periods
The result comes from one model, US English and one collection window.
So 90.7% should not be translated into 90.7% AI market visibility, share of voice, recommendation probability, category demand or search wins. A strong rate remains valuable: it shows that when the brand was already relevant, first-party information usually participated in the answer.
Discovery paths
Branded discoverability and market visibility are different selection problems
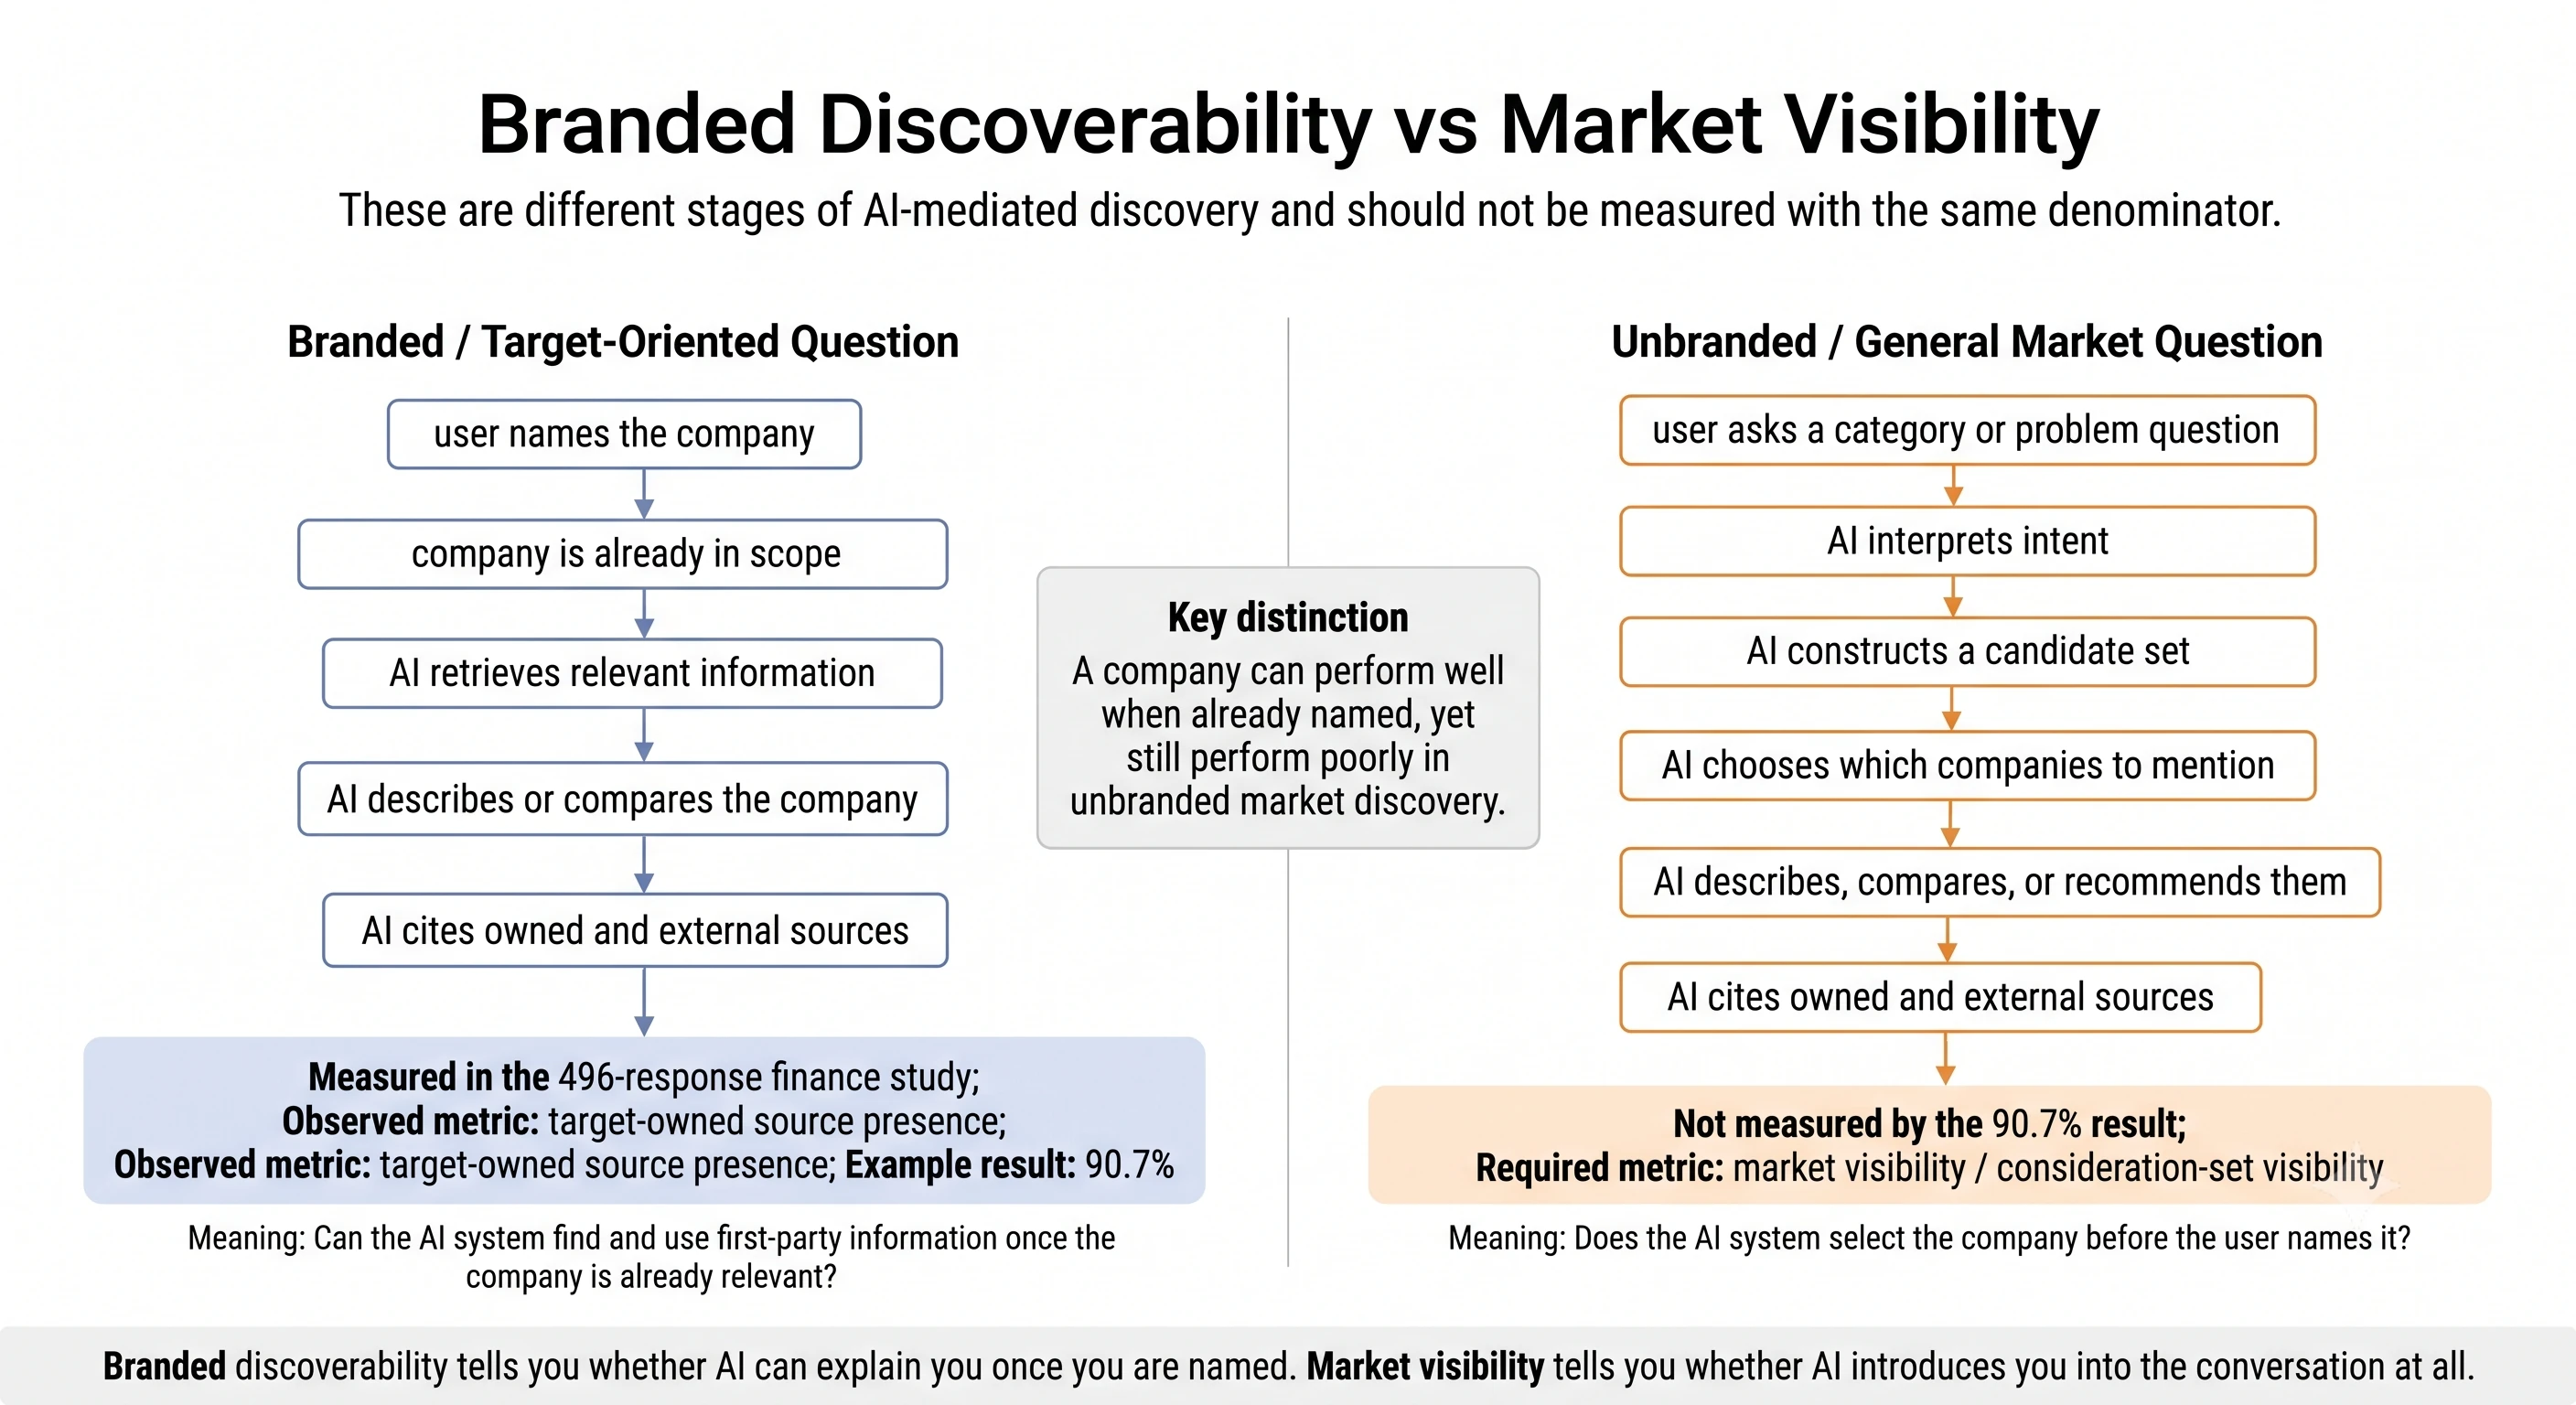
A branded question begins after the company has already been selected. An unbranded market question requires the AI system to construct and narrow a candidate set first.
“How does Company A compare with Company B for international payments?” places both companies inside the task. The system must recognise each entity, retrieve or use relevant information, describe or compare them and select evidence. Target-owned source presence tells us whether a company’s own information participates at this stage.
“Which providers are best for a mid-sized business making international supplier payments?” begins earlier. The system must interpret the buyer’s category and intent, construct a candidate set, decide which companies are relevant enough to mention, choose which make the final answer, characterise them and attach evidence.
A company can perform well at the evidence stage when already named and still perform poorly at candidate selection in an unbranded question. The reverse is also possible: a company may be mentioned frequently in broad market questions while its own domain rarely appears as visible evidence. The outcomes measure different parts of discovery.
Conceptual framework
A five-layer framework for AI visibility measurement
A useful way to separate AI visibility signals is to distinguish five measurement layers. This framework is derived from the analysis and the observable AI-answer workflow; it is not an empirically validated causal five-stage model.
| Layer | Core question | Example measure | What failure means |
|---|---|---|---|
| 1. Branded discoverability | When users ask about us, can AI find and use our information? | Target-owned source presence | Identity, retrievability or first-party evidence gap. |
| 2. Consideration-set visibility | When users do not name us, does AI include us? | Unbranded mention or shortlist rate. | Candidate-selection or category-positioning gap. |
| 3. Representation quality | Once included, are we described accurately? | Factual accuracy, attribute coverage and positioning consistency. | Characterisation or information-alignment gap. |
| 4. Evidence visibility | Which sources shape the answer about us? | Owned and external citation presence, source mix and claim support. | Evidence or third-party information gap. |
| 5. Recommendation outcome | Are we recommended for the right buyers and use cases? | Shortlist rate, recommendation direction and ordered position. | Competitive or decision-fit gap. |
The 496-response study primarily informs Layer 1, with additional evidence about Layer 4. It does not directly estimate Layer 2. That is why its 90.7% result should not be promoted as general market visibility.
Descriptive variation
Branded discoverability was broad, but not uniform
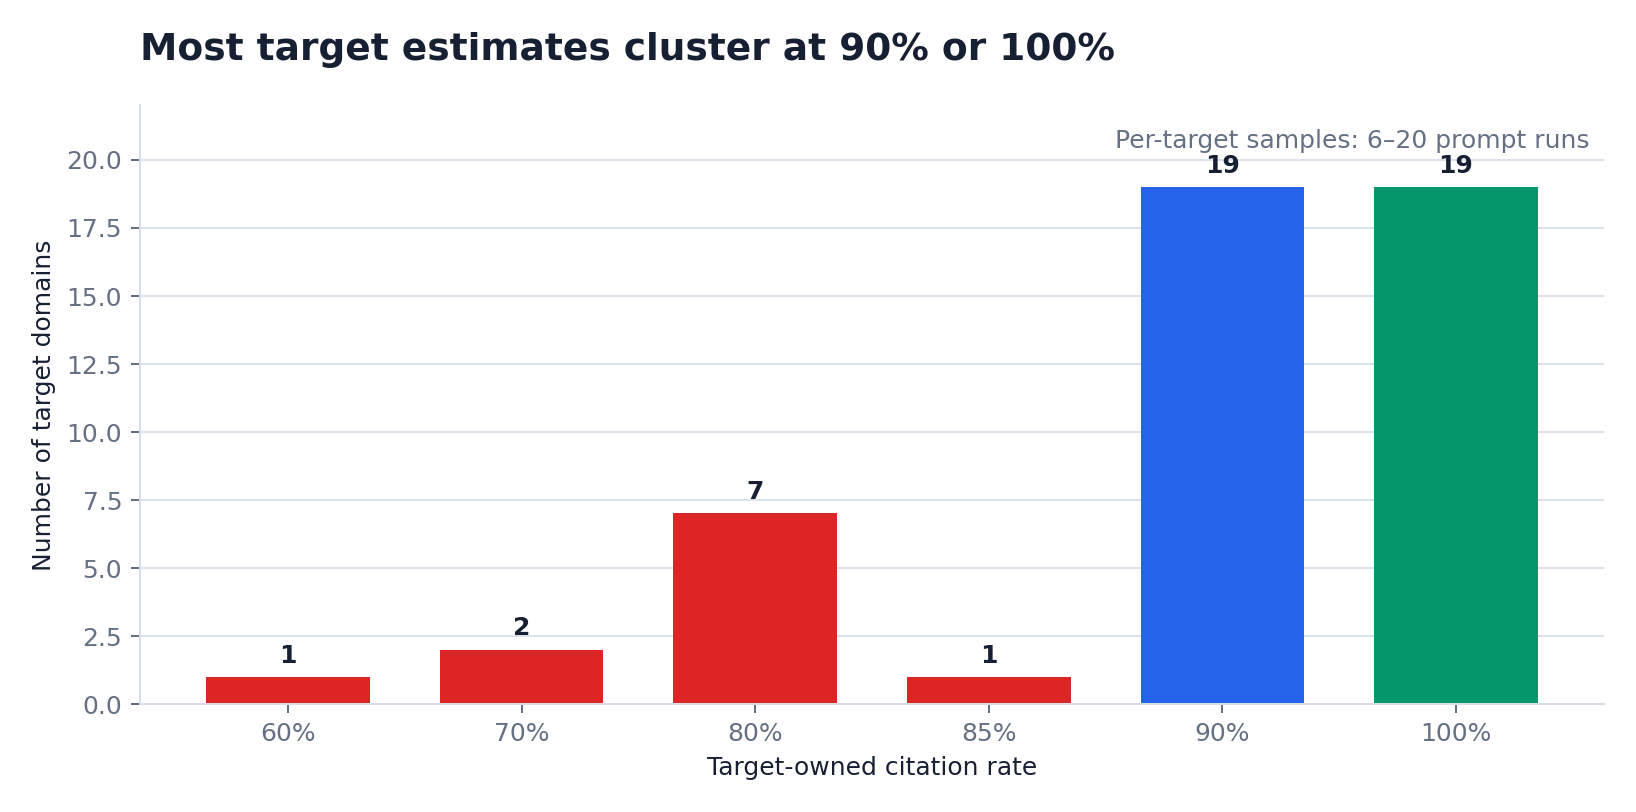
Across the 49 target domains, the median observed target-owned source rate was 90%. Nineteen targets recorded 100% in their tested prompts, 11 fell below 90%, and the minimum observed target-level rate was 60%.
For a target with lower owned-source presence, the distribution can motivate diagnosis:
- Locate the missing prompt families
Separate direct brand questions from comparisons and identify where first-party evidence fails to appear.
- Check entity and domain association
Test whether the system consistently connects the brand to the correct domain and product facts.
- Retest across conditions
Determine whether the pattern survives repeats, models and collection waves.
The distribution cannot support a company league table. With around 10 observations for many targets, one response can move the percentage by 10 points. Exposure ranged from 6 to 20 runs, and the design was not a balanced randomised head-to-head test. A 100% result from 6 or 10 runs is a perfect observed record for that small set, not near-certain future performance.
Outcome boundary
Owned citation is not recommendation or endorsement
A company-owned source appearing in an answer shows evidence participation. It does not establish:
- Recommendation or first position
The company may be cited without being shortlisted, ordered first or recommended.
- Positive sentiment or comparison victory
An owned source can supply facts while the answer remains neutral, critical or favourable to another company.
- Causal influence
Source presence does not show that the source caused the answer or controlled its conclusion.
In a comparison, an AI system may use a company website for pricing, product features, eligibility rules or documentation while relying on external sources for evaluation, criticism or category context. Owned-source presence is useful, but it is not outcome dominance.
Diagnostic clarity
Why a single AI visibility score can be misleading
A composite can be useful when its components and decision context remain visible. It becomes misleading when it collapses different stages and hides the intervention required.
- Company A
Frequently appears in unbranded category answers but is usually described through third-party sources: strong candidate selection, weaker owned evidence participation.
- Company B
Rarely appears unless named, but its own sources then appear consistently: a consideration-set problem rather than a branded discoverability problem.
- Company C
Appears and is cited often, but its positioning is repeatedly described incorrectly: a representation-quality problem.
- Company D
Is accurately represented and well sourced but rarely makes high-intent shortlists: a recommendation-outcome problem.
There is no single defensible “winner” without defining the score’s purpose. A useful measurement system preserves the stage at which each signal was observed.
Resolution boundary
Source identity sets a second measurement boundary
The study contained 6,884 raw grounding source objects. After removing 2,224 retrieval artifacts, 4,660 named source objects remained. Only 2 had canonical page identities; the other 4,658 relied on title-based fallback identity. In addition, 3,912 named objects—83.9%—remained unclassified by source type.
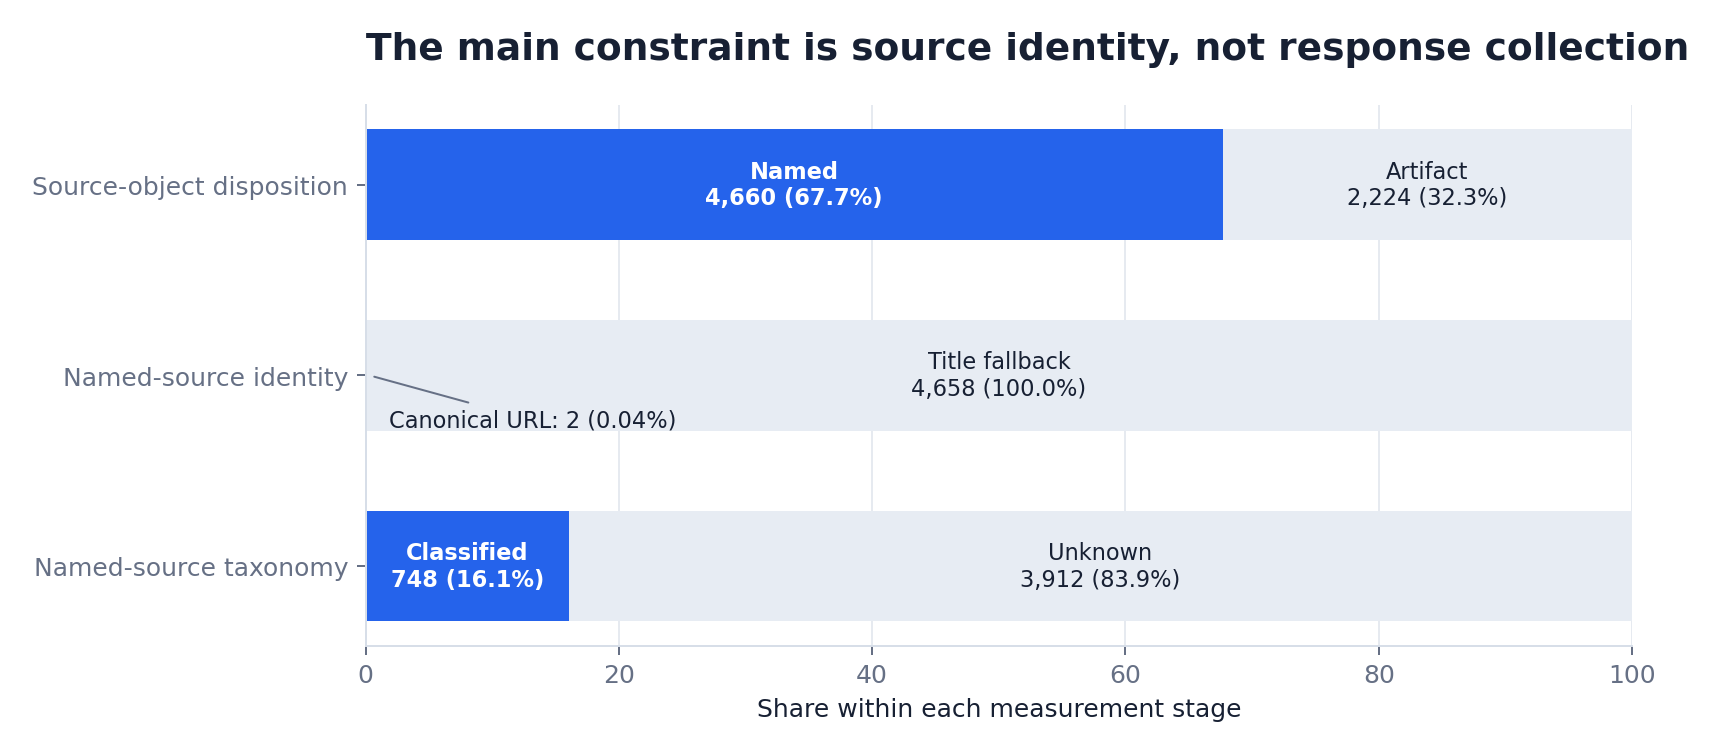
Response-level target-owned presence and inferred publisher incidence can be studied. Exact product-page performance, page-template effects, schema effects, backlink effects and page-level optimisation are effectively unavailable. If the unit of identity is publisher-level, the recommendation should remain publisher-level. Page-level advice requires page-level identity.
Proposed experiment
What a true market-visibility study would require
General market visibility needs a different experiment—one that allows brands to be absent from the prompt and selected by the model.
- 1. A representative unbranded query universe
Cover category discovery, problem-led questions, use cases, eligibility, education, comparison, shortlisting, pricing, trust, compliance and risk without inserting target names.
- 2. A defined eligible candidate universe
Account for geography, customer segment, product class, regulation, industry, company size, use case and commercial constraints so irrelevant absences are not treated as failure.
- 3. Separate mention and recommendation outcomes
Report mention, shortlist, ordered position, recommendation direction, citations, factual accuracy, positioning accuracy and sentiment separately.
- 4. Prompt repetition
Repeat important conditions enough times to estimate generative variability instead of treating one answer as a stable market state.
- 5. Longitudinal collection
Collect multiple waves because answers, retrieval systems and source environments change.
- 6. Model and market segmentation
Keep platforms, model snapshots, countries and languages visible rather than averaging incompatible contexts.
- 7. Cluster-aware inference
Use a target-cluster bootstrap, hierarchical model or another approach that respects dependence among targets, query families, repeats and collection dates.
Decision use
How executives should use branded discoverability
The 90.7% result is most useful as a benchmark for one stage of AI-mediated discovery. When a prospect, analyst, customer or partner already knows the company and asks an AI system to explain or compare it, first-party evidence should generally be available.
For weak branded discoverability, investigate:
- Entity resolution
Does the system consistently associate the brand with the correct domain?
- First-party answerability
Are product, comparison, pricing, eligibility, compliance and market facts clear and consistent?
- Evidence substitution
Which branded question families rely entirely on outdated or low-quality third-party summaries?
- Stability
Does the absence persist across prompt repeats, models and collection waves?
For strong branded discoverability, the next question is different: does the company enter the answer when the user has not named it? That is a consideration-set question. Strong Layer 1 performance should lead to Layer 2 measurement rather than complacency.
Supported conclusions
What this analysis supports
- A real target-oriented presence measurement
450 of 496 target-oriented prompt runs contained a target-owned source.
- Common first-party participation once in scope
Owned information usually appeared in branded and comparison-oriented responses.
- Descriptive variation across targets
Observed rates ranged from 60% to 100%, identifying gaps that can be investigated without ranking companies.
- Distinct measurement problems
Branded discoverability begins after the target enters the task; market visibility tests whether the target is selected before the user names it.
- Evidence participation, not endorsement
Owned citation records source presence and does not establish recommendation or competitive victory.
- A resolution ceiling
Publisher-level identity supports publisher-level conclusions; page-level optimisation requires page-level identity.
Unsupported conclusions
What this analysis does not support
- 90.7% general market visibility, share of voice or recommendation probability
The denominator contains target-oriented prompts, not representative unbranded demand.
- Unaided company discovery or a stable ranking
The targets were already framed in the questions and received unequal samples of 6 to 20 runs.
- Causal authority or recommendation effects
Source presence does not show that a publisher or owned source caused the answer outcome.
- Exact page optimisation or precise channel shares
Canonical page identity and source-type classification were too limited.
- Longitudinal, cross-model or international generality
The study used one model snapshot, US English and a single collection window.
Statistical boundary
Methodological relationship to the 496-response Finance GEO study
This paper is a companion analysis, not an independent experiment. The complete empirical source analysis remains in Research 01; this paper deliberately narrows the question to measurement interpretation.
The 450/496 result is prompt-weighted and descriptive. Its 95% Wilson interval of 87.9% to 93.0% assumes independent Bernoulli observations, while prompt observations are clustered by target, prompt family and a single model snapshot. The interval does not fully model those dependencies.
Stronger external benchmarking should use a target-cluster bootstrap, hierarchical model or another cluster-aware approach within a balanced repeated design. Target percentages are also descriptive because target exposure ranged from 6 to 20 runs.
Measurement programme
How to operationalise the five-layer framework
The conceptual layers become useful when teams measure each one separately and connect failures to different actions.
- 1. Explain us when named
Measure target-owned source presence, correct entity/domain resolution, answer completeness and factual accuracy.
- 2. Select us when not named
Measure unbranded mention rate, shortlist frequency, candidate-set coverage and ordered position.
- 3. Describe us correctly
Measure factual accuracy, positioning consistency, product/use-case fit, omissions and hallucinations.
- 4. Identify the evidence environment
Measure owned and external citation presence, publisher incidence, source independence and claim-level support.
- 5. Evaluate decision outcomes
Measure recommendation direction, shortlist rate, comparative framing and fit by buyer, use case and market.
Keeping the layers separate prevents an apparent overall score from obscuring whether the intervention belongs in entity resolution, first-party publishing, category positioning, third-party evidence, representation correction or competitive fit.
Conclusion
Branded discoverability tells you whether AI can explain you once named
The 496-response finance GEO study found target-owned sources in 90.7% of target-oriented prompt runs. That is meaningful evidence that first-party information was commonly available once a finance target entered the task. It is not general market visibility.
Market visibility begins earlier: does the AI system select the company when the user has not named it? Answering that requires representative unbranded questions, a defined candidate framework, repeated observations, multiple collection waves, model and market segmentation, separate mention and recommendation outcomes, and cluster-aware inference.
Branded discoverability tells a company whether AI can explain it once named. Market visibility tells the company whether AI introduces it into the conversation at all. A serious AI answer measurement programme needs both—and should not confuse one for the other.
FAQ
Frequently asked questions
What does the 90.7% figure measure?
It measures the share of 496 target-oriented finance prompt runs in which at least one named source attributable to the target domain appeared. The target company was already part of the research frame.
Does 90.7% mean the companies had 90.7% AI market visibility?
No. The prompts were target-oriented. The study did not use a representative unbranded finance query universe in which the model had to independently select companies from the market.
Is branded discoverability the same as brand mention visibility?
No. The observed measure is narrower: target-owned source presence after the target was already in scope. A brand can be mentioned without an owned citation, and an owned source can appear without implying a positive recommendation.
Does an owned citation mean the AI system endorsed the company?
No. An owned source can provide factual evidence while the answer remains neutral, critical or favourable to another company. Citation presence is evidence participation, not endorsement.
Can the 49 finance companies be ranked from this dataset?
Not reliably. Target sample sizes ranged from 6 to 20 prompt runs, most targets had small denominators, and the prompt mix was not a balanced randomised head-to-head design.
Can the study identify which exact pages caused visibility?
Almost never. Only 2 of 4,660 named source objects had canonical page identities; 4,658 relied on title-fallback identity. That supports publisher-level presence analysis, not reliable page-level causal or optimisation claims.
What would a true market-visibility study measure?
It would use unbranded category and buyer-intent questions, define eligible companies for each query, repeat prompts across collection waves, segment by model and market, and report mention, shortlist, recommendation, citation, representation and accuracy separately.