Kojable research · Cross-Model Citation Study
More AI Citations Do Not Automatically Mean Better-Supported Answers
A citation marker shows that a source was attached to an answer. It does not show whether the important claims were cited or whether the source supports them.
Key finding
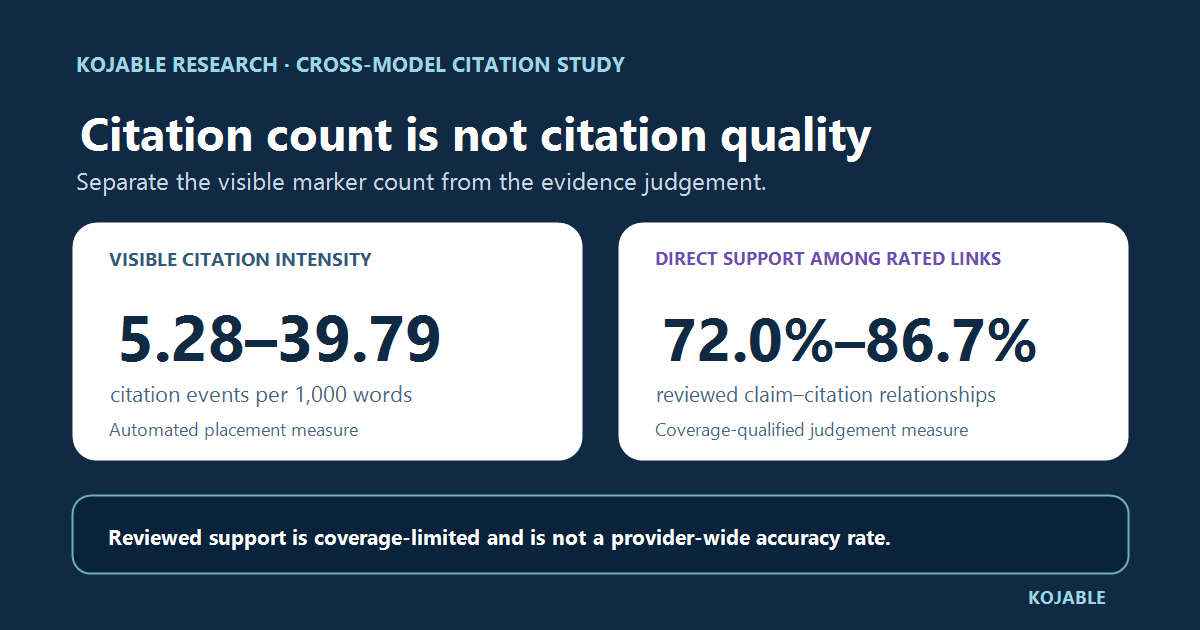
Citation density ranged from 5.28 to 39.79 events per 1,000 words, while direct support among reviewed links ranged from 72.0% to 86.7%. Citation volume, material-claim citation coverage and evidentiary support are different measurements.
Qualification: This companion uses the same fixed study as the flagship report; it is not a separate experiment or independent replication. Support review covers a stratified, coverage-limited subset of mapped claim-citation relationships, not provider-wide factual accuracy.
- 4 provider stacks
- 9 matched questions
- 1,298 mapped relationships
- 11 min read
Answer first
Does more citation volume mean better evidence?
Direct answer
No. More citation markers do not automatically mean a better-supported answer.
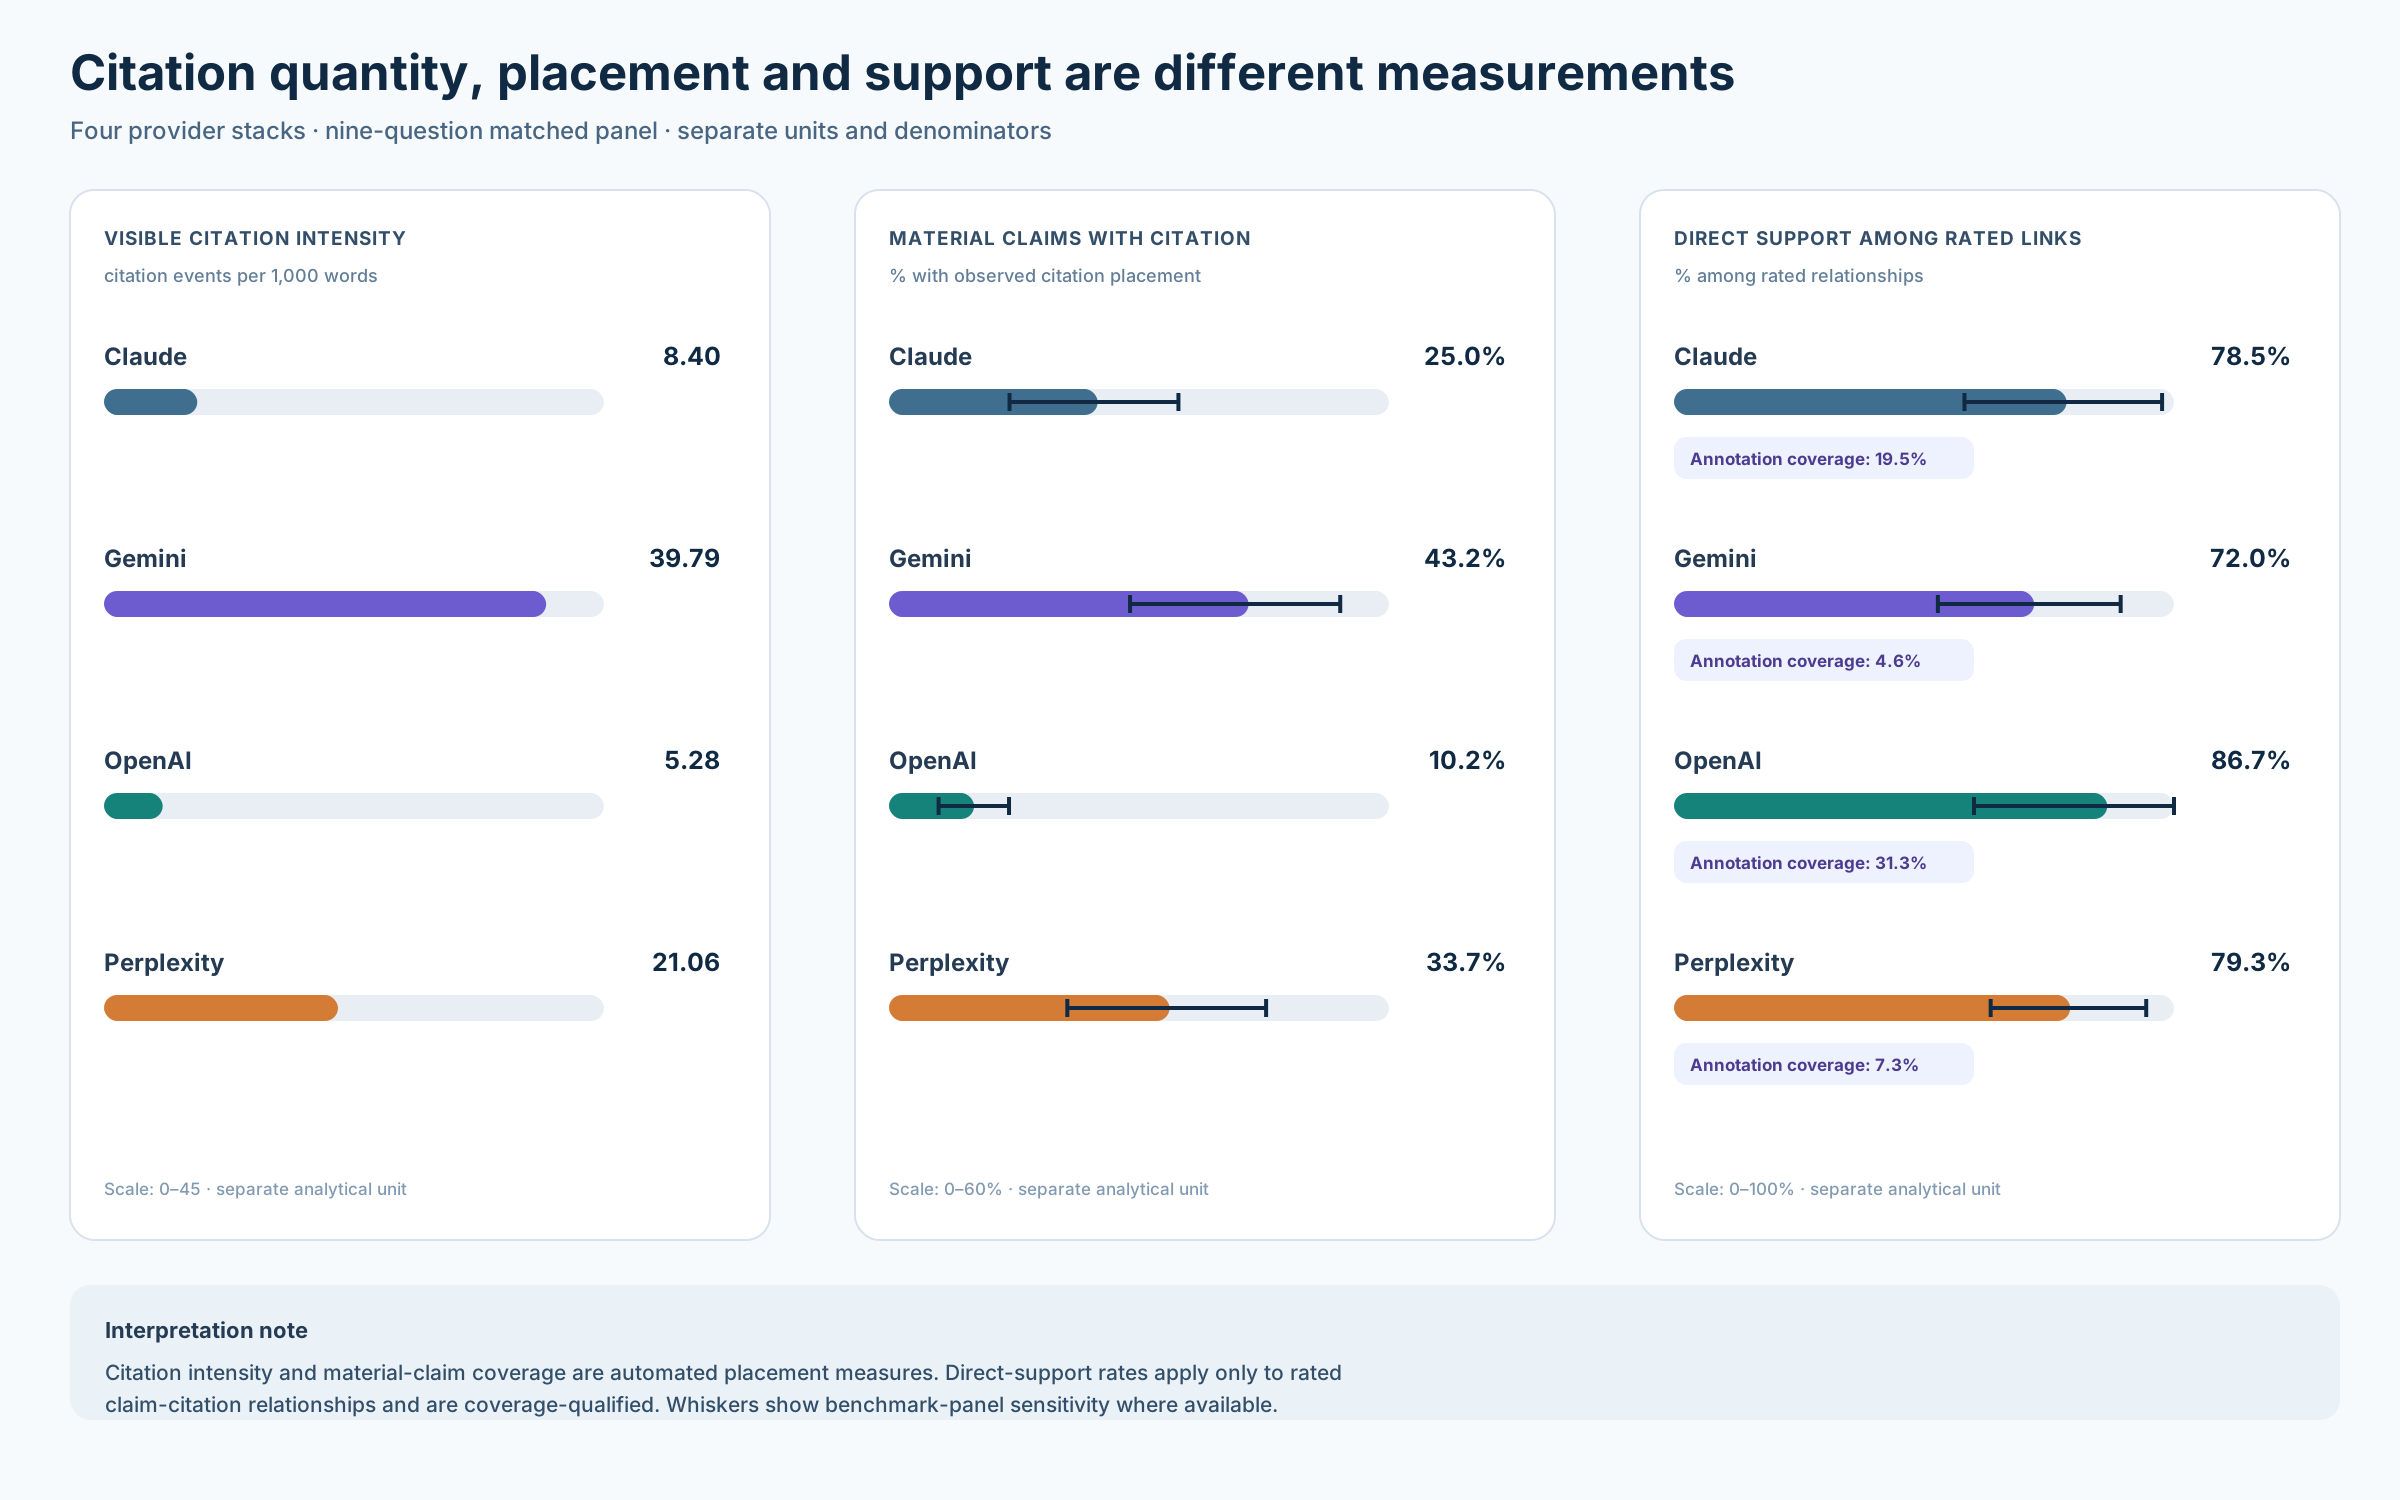
In the matched panel, Gemini produced the most visible citation events and OpenAI the fewest. Automated material-claim citation placement followed the same observed order. But reviewed direct support did not: OpenAI had the highest point estimate among rated links and Gemini the lowest.
- Central finding
Citation quantity and reviewed evidentiary support are not the same metric. The result does not establish that fewer citations are better, rank provider quality or estimate whole-answer accuracy.
A visible marker count cannot answer whether important claims are cited, whether the attached source supports the claim, or whether the whole answer is accurate.
Measurement model
Three different things are often called citation quality
The phrase “citation quality” can hide measurements that use different denominators and answer different questions. This study keeps three layers separate.
- Citation intensity
- Visible citation events per 1,000 answer words. This describes how citation-heavy an answer appears.
- Material-claim coverage
- The share of automatically identified material claims with an observed citation placement. This is an automated placement metric.
- Reviewed support
- Whether a rated source directly or partially supports its mapped claim. This is a coverage-limited judgement layer.
Finding 1
Citation volume varied dramatically
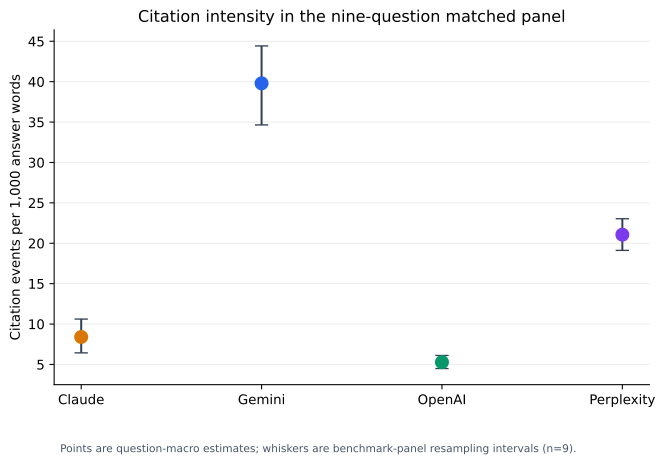
Visible citation density differed by more than sevenfold between the lowest and highest point estimates. Gemini produced 39.79 citation events per 1,000 answer words, followed by Perplexity at 21.06, Claude at 8.40 and OpenAI at 5.28.
| Provider | Citation events per 1,000 words |
|---|---|
| Gemini | 39.79 |
| Perplexity | 21.06 |
| Claude | 8.40 |
| OpenAI | 5.28 |
Normalising by answer length improves comparability, but the result remains a count. Interface and answer behaviour can affect whether a system attaches several sources around a paragraph, one source to a larger span or relatively few markers across a long response.
Finding 2
Material-claim citation coverage also differed
Across all successful responses, the deterministic claim layer produced 2,993 claim rows, including 1,457 material claims. The automated layer then measured whether each material claim had an observed citation placement.
| Provider | Material-claim citation coverage |
|---|---|
| Gemini | 43.2% |
| Perplexity | 33.7% |
| Claude | 25.0% |
| OpenAI | 10.2% |
This is closer to the structure of the substantive answer than raw marker count. It can reveal an answer that looks heavily cited while leaving important material claims without an observed citation placement. It still does not semantically establish that the source proves the claim.
- What placement can show
Whether a material claim has an observed mapped citation under the automated operational definition.
- What placement cannot show
Whether the attached source is current, authoritative or sufficiently specific to support the claim.
Finding 3
Reviewed support tells a different story
The study separately reviewed a stratified sample of 120 claim-citation relationships from 1,298 mapped relationships. Among rated links in the primary matched panel, direct-support point estimates ranged from 72.0% for Gemini to 86.7% for OpenAI.
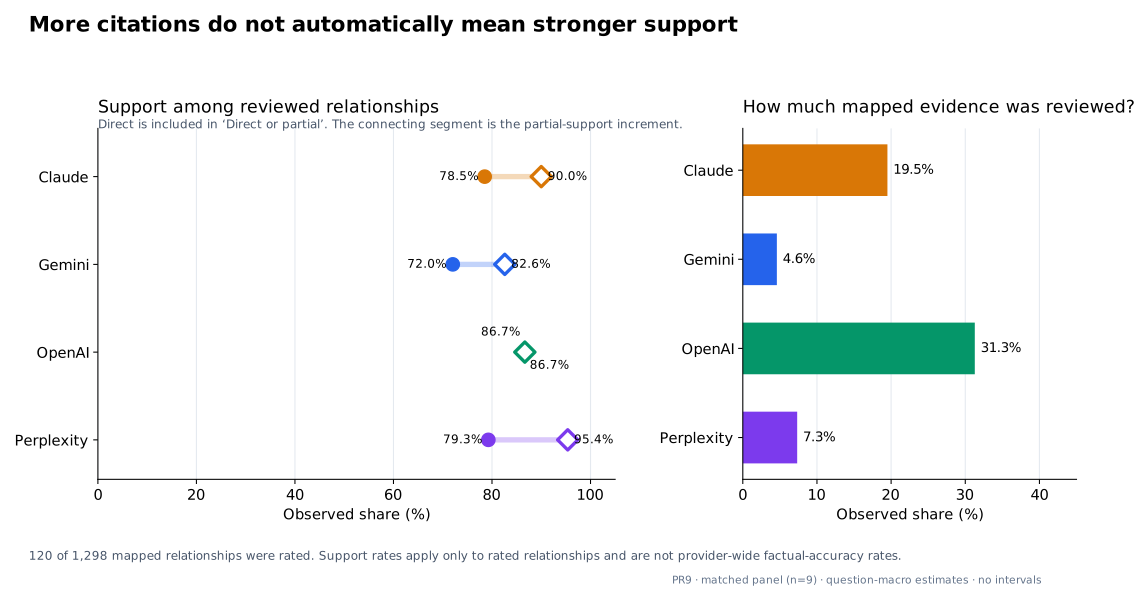
| Provider | Direct support | Direct or partial | Annotation coverage |
|---|---|---|---|
| OpenAI | 86.7% | 86.7% | 31.3% |
| Perplexity | 79.3% | 95.4% | 7.3% |
| Claude | 78.5% | 90.0% | 19.5% |
| Gemini | 72.0% | 82.6% | 4.6% |
The support ordering does not reproduce the citation-density order. That is why citation count is insufficient as a quality proxy. It would also be wrong to reverse the argument and claim that fewer citations mean better citations.
Coverage context
Why annotation coverage matters
The review sample included 30 relationships per provider across the overall study, while the providers produced very different numbers of mapped claim-citation relationships: Claude 143, Gemini 650, OpenAI 92 and Perplexity 413.
| Provider | Annotation coverage | Mapped relationships overall |
|---|---|---|
| OpenAI | 31.3% | 92 |
| Claude | 19.5% | 143 |
| Perplexity | 7.3% | 413 |
| Gemini | 4.6% | 650 |
Overall, the sample covered 120 of 1,298 mapped relationships, or approximately 9.2%. Missing review labels remained missing: they were not recoded as unclear, unsupported or zero support.
- Direct
- The reviewed evidence directly supports the mapped claim.
- Partial
- The evidence supports part, but not all, of the mapped claim.
- Other resolved labels
- Indirect, unclear and contradictory remain separate outcomes; direct-or-partial contains the direct group.
Evidence review
What the review process actually measured
Each of the 120 sampled relationships was assessed by one human reviewer and one AI-assisted web-research reviewer. This was not a two-human review. Disagreements were adjudicated.
- Sample mapped relationships
Select 30 per provider across questions using the study's stratified review design.
- Assess claim and evidence together
One human and one AI-assisted web-research reviewer assign support labels independently.
- Adjudicate disagreement
The initial assessors agreed on 93 of 120 relationships; 27 disagreements were adjudicated.
Initial raw agreement was 77.5% and Cohen's kappa was approximately 0.477. The final labels were 90 direct, 14 partial, 2 indirect, 7 unclear and 7 contradictory.
Evaluation contains judgement because a source may support only part of a compound sentence, supply an example rather than general evidence, use a different definition or provide related context without directly establishing the claim.
Measurement practice
Why citation count is a weak standalone KPI
Counts are attractive because they are easy to collect and compare. But optimising for the number of citation markers can reward an answer that leaves important claims uncited or attaches loosely related evidence.
- Answer A: marker-heavy
Twenty citations appear, but several important claims are uncited and some sources only loosely relate to nearby text.
- Answer B: claim-focused
Six citations are attached to the main factual claims and directly support them. Raw citation count would still favour A.
A stronger measurement stack asks how citation-heavy the answer is, how much material content is visibly cited, whether the cited evidence supports the mapped claim, how much of that relationship has been reviewed, and whether the answer itself is accurate, complete and appropriately framed. This study measures the first four layers; it does not estimate the fifth.
Company implications
What this means for AI Answer Alignment
A cited source can influence how an AI system describes a company's capabilities, pricing, customer fit, market position, comparisons, advantages and disadvantages. A high citation count does not show whether that representation has sound evidence behind it.
- Claim
- Identify the specific statement a buyer will see.
- Source and support
- Determine which evidence is attached and whether it supports the statement.
- Representation
- Evaluate whether the resulting description is current, accurate and complete.
The useful progression is therefore claim → source → support → representation, not simply a larger marker count.
Method
Study design
This companion uses the same fixed responses and locked publication outputs as the flagship Cross-Model Citation Study. Ten designed B2B buyer questions were presented to four provider stacks, creating 40 expected provider-question cells. Thirty-nine responses succeeded; one Gemini response was missing. The primary comparison uses the nine questions completed by all four stacks.
Each provider-question cell contains one observed run. Provider results are question-macro estimates. Benchmark-panel resampling intervals describe sensitivity to the composition of this fixed question panel. They are not population confidence intervals, repeated-run intervals or measurements of provider stability.
Evidence boundaries
Limitations
- One observed run per cell
The benchmark does not establish run-to-run stability or longitudinal provider behaviour.
- Designed question panel
Ten questions were designed for the study rather than randomly sampled from every possible B2B buyer question.
- Automated claim placement
Material-claim coverage is operational, not a human-validated semantic truth for every claim.
- Stratified support sample
The review covers 120 of 1,298 mapped relationships and does not have equal provider-specific annotation coverage.
- Support is not answer accuracy
Direct support for one claim does not make the entire answer correct, and weak support does not prove the whole answer wrong.
- Judgement remains
Reviewer agreement was imperfect, and 27 of 120 initial labels required adjudication.
- No causal mechanism
Differences can reflect models, retrieval systems, search, orchestration, citation implementation and answer style.
- No four-point correlation claim
Four provider point estimates are not used to estimate a robust correlation, provider ranking or composite quality score.
Research record
Research and reproducibility
The public package contains citation-quality tables, provider profiles, claim-level mappings, review reconciliation, uncertainty outputs, metric definitions and publication manifests. This page introduces no new experimental metric.
View the Cross-Model Citation Study publication package on GitHub.
FAQ
Frequently asked questions
Does an AI answer with more citations have better evidence?
Not necessarily. Citation count measures visible citation frequency. It does not establish whether material claims are cited or whether the source actually supports each claim.
Which provider produced the most citations in this study?
Gemini had the highest citation density in the nine-question matched panel at 39.79 citation events per 1,000 words. Perplexity was 21.06, Claude 8.40 and OpenAI 5.28.
Which provider cited the largest share of material claims?
Gemini had the highest automated material-claim citation coverage at 43.2%, followed by Perplexity at 33.7%, Claude at 25.0% and OpenAI at 10.2%.
Which provider had the highest direct-support rate?
Among the reviewed claim-citation relationships in the matched panel, OpenAI had the highest question-macro direct-support point estimate at 86.7%. This is a coverage-limited sample result, not a provider-wide accuracy estimate.
Why was Gemini's annotation coverage lower?
The review sample included 30 relationships per provider across the overall study, while Gemini produced many more mapped claim-citation relationships than some other providers. This resulted in a smaller reviewed fraction for Gemini.
What does direct-or-partial support mean?
It counts reviewed relationships labelled either direct support or partial support. It contains the direct-support group and should not be read as a mutually exclusive category alongside direct support.
Were the support labels reviewed by two humans?
No. Each sampled relationship was assessed by one human reviewer and one AI-assisted web-research reviewer, with disagreements adjudicated.
Does this study measure hallucination rates?
No. Reviewed citation support is not an overall hallucination, factual-error or answer-accuracy rate.
From benchmark to company evidence
See what this looks like for your company
Research shows how AI systems behave across a broader sample. Kojable helps you measure how those systems describe, cite and compare your company across the buyer questions that matter.